شبیه‌سازی شبکه‌های بی سیم و کامپیوتری
شبیه سازی تخصصی شبکه‌های بی سیم و کامپیوتری مقاطع کارشناسی تا دکترا
  • شبیه سازی تخصصی شبکه‌های بی سیم و کامپیوتری مقاطع کارشناسی تا دکترا

مشخصات بلاگ
شبیه‌سازی شبکه‌های بی سیم و کامپیوتری

امکان سفارش، شبیه سازی مقاله و پایان نامه وجود دارد،
مطالب، با ذکر منبع قابل انتشار در سایت ها و وبلاگ ها و.. می باشد.
جهت دریافت مشاوره رایگان تماس بگیرید:

شماره تماس: 09147082079-0098
آیدی تلگرامی:https://t.me/MuosSA_NbO
جی میل :mo30no@gmail.com

تمامی کدهای این وبلاگ در حال حاضر به زبان متلب می باشد

«آنچه می‌دانیم ناچیز و آنچه نمی‌دانیم عظیم و وسیع است»
$$پیر سیمون لاپلاس$$

۱۱ مطلب در تیر ۱۴۰۱ ثبت شده است

چهارشنبه, ۲۹ تیر ۱۴۰۱، ۰۲:۳۹ ب.ظ

انمیشن ساعتگرد در صفحه فضایی

دسترسی به مختصات دلخواه در صفحه فضایی، تحت مختصات قطبی این امکان را فراهم می‌کند که براحتی اشای سه بعدی خود را در فضا رسم کنیم، در این پست سعی کردیم با ایجاد انمیشن خطی که به موازات آن صفحه فضایی عمود بر صفحه مرجع ایجاد خواهد شد را، نشان دهیم.

 کد ایجاد این انمیشن فضایی که در قالب کد اجرایی که قابل دانلود در بخش آخر این پست است، به شکل زیر است.

 for s=0:5:360

           
            passPoint1.deg=s;%format degree
            passPoint1.deg=deg2rad(passPoint1.deg);
            passPoint1.p=cos(passPoint1.deg);
            passPoint1.q=sin(passPoint1.deg);

            orignPoint.x=0;
            orignPoint.y=0;
            orignPoint.z=-scalerVal/coff(3);
            passPoint1.ft=-(coff(1)/coff(3))*passPoint1.p -(coff(2)/coff(3))*passPoint1.q-((scalerVal)/coff(3));
            passPoint1.x=[passPoint1.p;orignPoint.x];
            passPoint1.y=[passPoint1.q;orignPoint.y];
            passPoint1.z=[passPoint1.ft;orignPoint.z];
            
            h=plot3(passPoint1.x,passPoint1.y,passPoint1.z,'r-','LineWidth',2);hold on
             pause(.5)
            delete(h)
        end

در کد بالا دو نقطه انتخاب شده است که اولی نقطه ای به شعاع 1 در زوایه s( که بین 0 تا 360 درجه با فاصله 5 می باشد) و نقطه دوم مبداء صفحه می‌باشد. که با هر بار تغییر زاویه این خط تغییر می‌کند.

به دلیل طولانی بود کد اجرایی، فقط امکان دانلود آن وجود دارد.


نمونه فیلم خروجی:


دانلود کد اجرایی:


۰ نظر موافقین ۰ مخالفین ۰ ۲۹ تیر ۰۱ ، ۱۴:۳۹
موسی حسن زاده
سه شنبه, ۲۸ تیر ۱۴۰۱، ۰۸:۲۷ ب.ظ

مختصات صفحه فضایی و نحوه درجه بندی آن

در پست های قبلی، نحوه رسم چند ضلعی یا نقطه یا نمودار روی صفحه فضایی را تشریح کردیم، اما سوال اینجاست که مبداء این صفحات فضایی کجاست؟

جواب: مبداء صفحات فضایی در صورتی که ثابت d در معادله صفحه ax+by+cz+d=0 برابر صفر باشد، همان (0،0،0) خواهد بود، اما در صورتی این ثابت برابر صفر نباشد مبداء آن  برابر با( 0,0,-d) خواهد بود. یعنی اگر بخواهیم نمودار یا نقطه ای را رسم کنیم، نسبت به مبداء صفحه فضایی رسم می‌شود.

سوال بعدی که ممکن است پیش بیاید این است که، اگر بخواهیم نقاطی را در زوایای مختلف این صفحه فضایی رسم کنیم چکار باید بکنیم؟

جواب این است که همانطور که می توانیم یک چند ضلعی را در روی صفحه فضایی رسم کنیم، می توانیم زوایای آن را نیز مشخص کنیم.

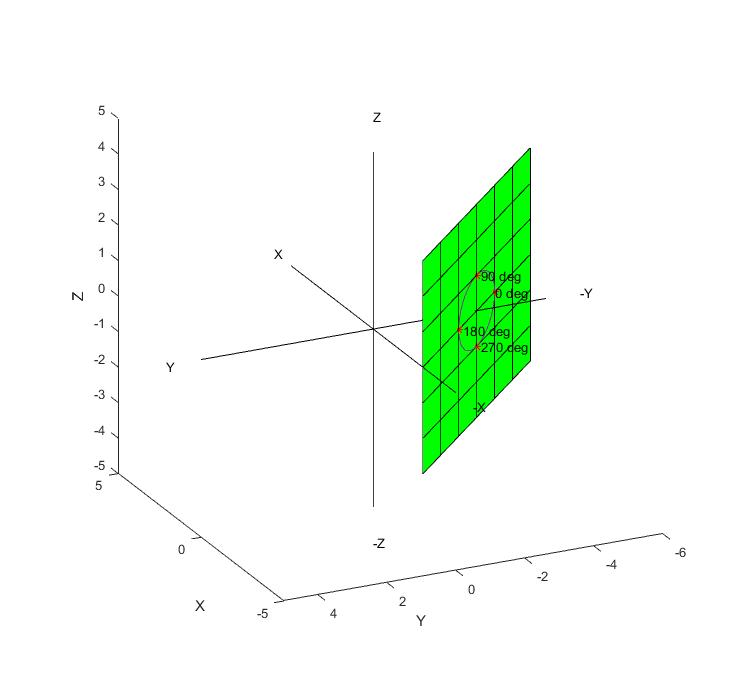
برای این کار کافی است مختصات مورد نظر خودمان را تعیین کنیم، مثلا p1=cos(0) , q1=sin(0)  و تابع ft  این نقطه را محاسبه کنیم( که در کد زیر روش آن نشان داده شده است)، حالا اگر هدف ما این باشد که در زاویه صفر درجه صفحه عمود بر صفحه مرجع را پیدا کرده و شکل دلخواه خود را روی آن رسم کنیم، در آنصورت کافی است که با بدست اوردن دو نقطه  و بردار نرمال صفحه مرجع، که نقطه اول آن مبداء صفحه فضایی و نقطه دوم  مقدار p, q  و بردار نرمال صفحه مرجع صفحه عمود را در زوایه مد نظر رسم کنیم و سپس شکل دلخواه خود را روی صفحه عمود در زاویه مدنظر رسم کنیم.

این تکنیک به ما اجازه می ده که تسلط کاملی به فضای سه بعدی داشته باشیم، بدون اینکه نیازی باشد از دستگاه‌های مختصات کروی و... استفاده کنیم.

البته نحوه بدست آوردن صفحات عمود در پست‌های بعدی به شکل مفصل تشریح خواهد شد، در این پست صرفا هدف ما تعیین زوایای مرجع(0، 90، 180 و270) بود.


کد شناسای زوایای مرجع در صفحه فضایی

%% display angle point on plan  
        p1=cos(0);
        q1=sin(0);
        ft1=-(coff(1)/coff(3))*p1 -(coff(2)/coff(3))*q1-((scalerVal)/coff(3)) ;
        text(p1 ,q1 ,ft1,'0 deg'); hold on
        plot3(p1 ,q1 ,ft1,'*r'); hold on

        p2=cos(pi/2);
        q2=sin(pi/2);
        ft2=-(coff(1)/coff(3))*p2 -(coff(2)/coff(3))*q2-((scalerVal)/coff(3)) ;
        text(p2 ,q2 ,ft2,' 90 deg'); hold on
        plot3(p2 ,q2,ft2,'*r'); hold on


        p3=cos(pi);
        q3=sin(pi);
        ft3=-(coff(1)/coff(3))*p3 -(coff(2)/coff(3))*q3-((scalerVal)/coff(3)) ;
        text(p3 ,q3 ,ft3,' 180 deg'); hold on
        plot3(p3 ,q3 ,ft3,'*r'); hold on

        p4=cos(3*pi/2);
        q4=sin(3*pi/2);
        ft4=-(coff(1)/coff(3))*p4 -(coff(2)/coff(3))*q4-((scalerVal)/coff(3)) ;
        text(p4 ,q4 ,ft4,' 270 deg'); hold on
        plot3(p4 ,q4 ,ft4,'*r'); hold on

کد بالا بخشی از کد اصلی می‌باشد، شما در کد زیر می‌توانید با تغییر تابع صفحه که به فرم  plan='1x+1y+0z+3' در سطر 30 آورده شده موقعیت زوایای مرجع را روی آن مشاهده کنید.


کد اجرایی:

%%%%%%%%%%%%%%%%%%%%%%%%%%-----------software details-----------%%%%%%%%%%%%%%%%%%%%%%

%devloped in Iran(ardebil)                                       %
%Copyright (C) 2022(1401) by moussa hasanzadeh as the head devloper %%
%All rights reserved.                                             %
%programed in mathlab 2016
%gmail:mo30no@gmail.com
%phone 09147082079


%% clear and close all child forms
% delete(allchild(0));close all;
clear;
clc;

%% plot coordinates system in 3D area and labeling
plot3([-5;5] ,[-5;5]*0,[-5;5]*0,'k');hold on;
plot3([-5;5]*0,[-5;5],[-5;5]*0,'k');hold on
plot3([-5;5]*0,[-5;5]*0,[-5;5],'k');hold on
text([-6;6],[-6;6]*0,[-6;6]*0,{'-X','X'});hold on;
text([-6;6]*0,[-6;6],[-6;6]*0,{'-Y','Y'});hold on
text([-6;6]*0,[-6;6]*0,[-6;6],{'-Z','Z'});hold on
xlabel('X');
ylabel('Y');
zlabel('Z');


%% convert implicit plan formula as parametric form
syms x y z scalerVal t;
plan='1x+1y+0z+3';%% plan as inplicit form '2x+3y+1z+3'= pishfarz
% plan='-6x+5y-3z+0';%% plan perpendicular to '2x+3y+1z+0' pass from (-1 0 2) and (1 0 -2)


x=[-3:3];
y=[-3:3];
z=[-3:3];
%function to draw on the plan
side=50;
t=linspace(0,2*pi,side+1);
p=cos(t) ;%x coordinate
q=sin(t) ;% y coordinate

pluIdex1=strfind(plan,'+');%% find plus index in plan formula
minIdex2=strfind(plan,'-');
pluIdex=sort([pluIdex1,minIdex2]);

xIndex=strfind(plan, 'x' );
if isempty(xIndex)
    xIndex=1;
end

yIndex=strfind(plan, 'y' );
if isempty(yIndex)
    yIndex=2;
end

zIndex=strfind(plan, 'z' );
if isempty(zIndex)
    zIndex=3;
end

[~,indexVar]=sort([xIndex,yIndex,zIndex]);
cellCof=strsplit(plan,{'x','y','z','*'});

try
    cofX=str2double(cellCof{indexVar==1});
catch
    cofX=0;
end

try
    cofY=str2double(cellCof{indexVar==2});
catch
    cofY=0;
end

try
    cofZ=str2double(cellCof{indexVar==3});
catch
    cofZ=0;
end


scalerPlusIndex=strsplit(plan,'+');
isit=0;
%% extracting positive scaler
for s=1:length(scalerPlusIndex)
    scalerVal=str2num(scalerPlusIndex{s});
    if ~isempty(scalerVal)
        isit=1;
        break;
    else
        scalerVal=0;
    end
end

%% extracting negative scaler
if isit==0
    scalerMinusIndex=strsplit(plan,'-');
    for s=1:length(scalerMinusIndex)
        scalerVal=str2num(scalerMinusIndex{s});
        if ~isempty(scalerVal)
            scalerVal=-scalerVal;
            break;
        else
            scalerVal=0;
        end
    end
end

coff=[cofX,cofY,cofZ];


funcIndex=find(coff);funcIndex=funcIndex(end);
switch funcIndex
    case 1

        [y,z]=meshgrid(y,z);
        x=-(coff(2)/coff(1))*y -(coff(3)/coff(1))*z-scalerVal/coff(1);
        ft=-(coff(2)/coff(1))*p -(coff(3)/coff(1))*q-scalerVal/coff(1);
        plot3(ft,p,q);hold on

        %% display angle point on plan p1=cos(0);
        p1=cos(0);
        q1=sin(0);
        ft1=-(coff(2)/coff(1))*p1 -(coff(3)/coff(1))*q1-scalerVal/coff(1);
        text(ft1,p1 ,q1 ,'0 deg'); hold on
        plot3(ft1,p1 ,q1 ,'*r'); hold on

        p2=cos(pi/2);
        q2=sin(pi/2);
        ft2=-(coff(2)/coff(1))*p2 -(coff(3)/coff(1))*q2-scalerVal/coff(1);
        text(ft2,p2 ,q2 ,' 90 deg'); hold on
        plot3(ft2,p2 ,q2,'*r'); hold on


        p3=cos(pi);
        q3=sin(pi);
        ft3=-(coff(2)/coff(1))*p3 -(coff(3)/coff(1))*q3-scalerVal/coff(1) ;
        text(ft3,p3 ,q3 ,' 180 deg'); hold on
        plot3(ft3,p3 ,q3 ,'*r'); hold on

        p4=cos(3*pi/2);
        q4=sin(3*pi/2);
        ft4=-(coff(2)/coff(1))*p4 -(coff(3)/coff(1))*q4-scalerVal/coff(1);
        text(ft4,p4 ,q4 ,' 270 deg'); hold on
        plot3(ft4,p4 ,q4 ,'*r'); hold on


    case 2


        [x,z]=meshgrid(x,z);
        y=-(coff(1)/coff(2))*x -(coff(3)/coff(2))*z-scalerVal/coff(2);
        ft=-(coff(1)/coff(2))*p -(coff(3)/coff(2))*q-scalerVal/coff(2);
        plot3(p,ft,q);hold on

        %% display angle point on plan p1=cos(0);
        p1=cos(0);
        q1=sin(0);
        ft1=-(coff(1)/coff(2))*p1 -(coff(3)/coff(2))*q1-scalerVal/coff(2) ;
        text(p1 ,ft1,q1 ,'0 deg'); hold on
        plot3(p1 ,ft1,q1 ,'*r'); hold on

        p2=cos(pi/2);
        q2=sin(pi/2);
        ft2=-(coff(1)/coff(2))*p2 -(coff(3)/coff(2))*q2-scalerVal/coff(2);
        text(p2 ,ft2,q2 ,' 90 deg'); hold on
        plot3(p2 ,ft2,q2,'*r'); hold on


        p3=cos(pi);
        q3=sin(pi);
        ft3=-(coff(1)/coff(2))*p3 -(coff(3)/coff(2))*q3-scalerVal/coff(2) ;
        text(p3 ,ft3,q3 ,' 180 deg'); hold on
        plot3(p3 ,ft3,q3 ,'*r'); hold on

        p4=cos(3*pi/2);
        q4=sin(3*pi/2);
        ft4=-(coff(1)/coff(2))*p4 -(coff(3)/coff(2))*q4-scalerVal/coff(2) ;
        text(p4 ,ft4,q4 ,' 270 deg'); hold on
        plot3(p4 ,ft4,q4 ,'*r'); hold on


    case 3

        [x,y]=meshgrid(x,y);
        z=-(coff(1)/coff(3))*x -(coff(2)/coff(3))*y-scalerVal/coff(3);

        ft=-(coff(1)/coff(3))*p -(coff(2)/coff(3))*q-((scalerVal)/coff(3)) ;
        plot3(p ,q ,ft,'k-'); hold on

        %% display angle point on plan  
        p1=cos(0);
        q1=sin(0);
        ft1=-(coff(1)/coff(3))*p1 -(coff(2)/coff(3))*q1-((scalerVal)/coff(3)) ;
        text(p1 ,q1 ,ft1,'0 deg'); hold on
        plot3(p1 ,q1 ,ft1,'*r'); hold on

        p2=cos(pi/2);
        q2=sin(pi/2);
        ft2=-(coff(1)/coff(3))*p2 -(coff(2)/coff(3))*q2-((scalerVal)/coff(3)) ;
        text(p2 ,q2 ,ft2,' 90 deg'); hold on
        plot3(p2 ,q2,ft2,'*r'); hold on


        p3=cos(pi);
        q3=sin(pi);
        ft3=-(coff(1)/coff(3))*p3 -(coff(2)/coff(3))*q3-((scalerVal)/coff(3)) ;
        text(p3 ,q3 ,ft3,' 180 deg'); hold on
        plot3(p3 ,q3 ,ft3,'*r'); hold on

        p4=cos(3*pi/2);
        q4=sin(3*pi/2);
        ft4=-(coff(1)/coff(3))*p4 -(coff(2)/coff(3))*q4-((scalerVal)/coff(3)) ;
        text(p4 ,q4 ,ft4,' 270 deg'); hold on
        plot3(p4 ,q4 ,ft4,'*r'); hold on


end


surf(x ,y ,z ,'FaceColor','g');hold on


%%


axis equal
disp('');

%%%%%%%%%%%%%%%%%%%%%%%%%%-----------software details-----------%%%%%%%%%%%%%%%%%%%%%%

%devloped in Iran(ardebil)                                       %
%Copyright (C) 2022(1401) by moussa hasanzadeh as the head devloper %%
%All rights reserved.                                             %
%programed in mathlab 2016
%gmail:mo30no@gmail.com
%phone 09147082079

نمونه خروجی:
دانلود کد:


۰ نظر موافقین ۰ مخالفین ۰ ۲۸ تیر ۰۱ ، ۲۰:۲۷
موسی حسن زاده
سه شنبه, ۲۱ تیر ۱۴۰۱، ۰۸:۳۹ ب.ظ

حرکت انمیشن وار چند ضلعی روی یک صفحه دلخواه.

در این پست یک صفحه که فرمول آن در سطر 30 قرار دارد(و شما می توانید فرمول آن را تغییر دهید، فقط ضریب z غیر صفر باشد)، و یک چند ضلعی (دایره) روی آن به شکل تصادفی گردش می‌کند، به عبارتی هدف ما این بود که بتوانیم چند ضلعی یا هر تابع دیگری را روی صفحه به سمت راست یا چپ نسبی یا بالا و پایین نسبی صفحه گردش بدهیم.


کد اجرایی:

%%%%%%%%%%%%%%%%%%%%%%%%%%-----------software details-----------%%%%%%%%%%%%%%%%%%%%%%

%devloped in Iran(ardebil)                                       %
%Copyright (C) 2017(1396) by moussa hasanzadeh as the head devloper %%
%All rights reserved.                                             %
%programed in mathlab 2016
%gmail:mo30no@gmail.com
%phone 09147082079


%% clear and close all child forms
delete(allchild(0));close all;
clear;
clc;

%% plot coordinates system in 3D area and labeling
plot3([-5;5],[-5;5]*0,[-5;5]*0,'k');hold on;
plot3([-5;5]*0,[-5;5],[-5;5]*0,'k');hold on
plot3([-5;5]*0,[-5;5]*0,[-5;5],'k');hold on
text([-6;6],[-6;6]*0,[-6;6]*0,{'-X','X'});hold on;
text([-6;6]*0,[-6;6],[-6;6]*0,{'-Y','Y'});hold on
text([-6;6]*0,[-6;6]*0,[-6;6],{'-Z','Z'});hold on
xlabel('X');
ylabel('Y');
zlabel('Z');


%% convert implicit plan formula as parametric form
syms x y z scalerVal t;
plan='20*x+3*y+2*z+1';%% plan as inplicit form
x=[-3:3];
y=[-3:3];
z=[-3:3];
%function to draw on the plan
side=50;
t=linspace(0,2*pi,side+1);
p=cos(t) ;%x coordinate
q=sin(t)  ;% y coordinate

pluIdex=strfind(plan,'+');%% find plus index in plan formula
scalerIndex=strsplit(plan,'+');
for s=1:length(scalerIndex)
    scalerVal=str2num(scalerIndex{s});
    if ~isempty(scalerVal)
        break;
    else
        scalerVal=0;
    end
end

%% extract z coff

zIndex=strfind(plan,'z');
if ~isempty(zIndex)
    pluIZ=pluIdex(pluIdex<zIndex);
    if ( pluIZ)
        pluIZ=pluIZ(end);
        cofZIndex=pluIZ+1:zIndex-2;
        cofZ=str2double(plan(cofZIndex));
    else
        if (zIndex>1)
            pluIZ=1;
            cofZIndex=pluIZ:zIndex-2;
            cofZ=str2double(plan(cofZIndex));
        else
            cofZ=1;
        end
    end
else
    cofZ=0;

end
%% extract y coff

yIndex=strfind(plan,'y');
if ~isempty(yIndex)
    pluIY=pluIdex(pluIdex<yIndex);
    if ( pluIY)
        pluIY=pluIY(end);
        cofYIndex=pluIY+1:yIndex-2;
        cofY=str2double(plan(cofYIndex));
    else
        if (yIndex>1)
            pluIY=1;
            cofYIndex=pluIY:yIndex-2;
            cofY=str2double(plan(cofYIndex));
        else
            cofY=1;
        end
    end
else
    cofY=0;

end
%% extract x coff
xIndex=strfind(plan,'x');
if ~isempty(xIndex)
    pluIX=pluIdex(pluIdex<xIndex);
    if ( pluIX)
        pluIX=pluIX(end);
        cofXIndex=pluIX+1:xIndex-2;
        cofX=str2double(plan(cofXIndex));
    else
        if (xIndex>1)
            pluIX=1;
            cofXIndex=pluIX:xIndex-2;
            cofX=str2double(plan(cofXIndex));
        else
            cofX=1;
        end
    end
else
    cofX=0;

end

coff=[cofX,cofY,cofZ];


funcIndex=find(coff);funcIndex=funcIndex(end);
switch funcIndex
    case 1

        [y,z]=meshgrid(y,z);
        x=-(coff(2)/coff(1))*y -(coff(3)/coff(1))*z-scalerVal/coff(1);
        ft=(coff(2)/coff(1))*p +(coff(3)/coff(1))*q+scalerVal/coff(1);
        plot3(ft,p,q)

    case 2


        [x,z]=meshgrid(x,z);
        y=(coff(1)/coff(2))*x +(coff(3)/coff(2))*z+scalerVal/coff(2);
        ft=(coff(1)/coff(2))*p +(coff(3)/coff(2))*q+scalerVal/coff(2);
        plot3(p,ft,q)
    case 3

        [x,y]=meshgrid(x,y);
        z=(coff(1)/coff(3))*x +(coff(2)/coff(3))*y+scalerVal/coff(3);
        for s=1:50
            p=cos(t)+cos(rand*2-1)  ;%x coordinate
            q=sin(t)+sin(rand*2-1) ;% y coordinate
            ft=(coff(1)/coff(3))*p +(coff(2)/coff(3))*q+scalerVal/coff(3);
            surf(x,y,z,'FaceColor','g')


            h=plot3(p ,q ,ft,'k');
            pause(.5)
            delete(h);
        end
end


%%%%%%%%%%%%%%%%%%%%%%%%%%-----------software details-----------%%%%%%%%%%%%%%%%%%%%%%

%devloped in Iran(ardebil)                                       %
%Copyright (C) 2017(1396) by moussa hasanzadeh as the head devloper %%
%All rights reserved.                                             %
%programed in mathlab 2016
%gmail:mo30no@gmail.com
%phone 09147082079

نمونه ویدئوی خروجی:


دانلود کد 


۰ نظر موافقین ۰ مخالفین ۰ ۲۱ تیر ۰۱ ، ۲۰:۳۹
موسی حسن زاده

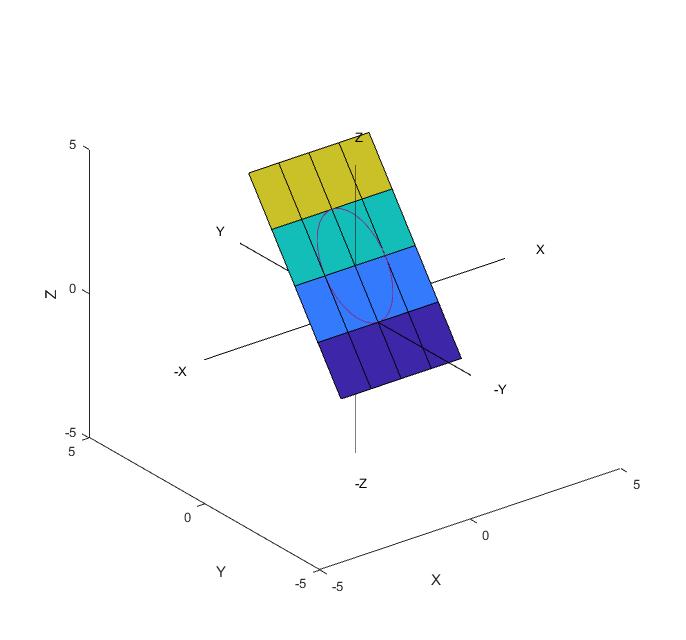
در این پست برخلاف پست های قبلی که رسم نمودار نیاز به کمی مهارت داشت، می توانید بدون نیاز به تلاش بیشتر، با تغییر p به عنوان مختصه نسبی x و q به عنوان مختصه نسبی y، نمودار یا چند ضلعی دلخواه خود را روی صفحه دلخواه( با تغییر فرمول صفحه) رسم کنید.

البته توصیه می شود که کد را آنالیز کنید و هر جا مشکل داشتید می توانید در بخش نظرات پرسش خود را مطرح کنید،

تذکر به نظران خصوصی پاسخ داده نمی شود.

کد اجرایی:

%%%%%%%%%%%%%%%%%%%%%%%%%%-----------software details-----------%%%%%%%%%%%%%%%%%%%%%%

%devloped in Iran(ardebil)                                       %
%Copyright (C) 2017(1396) by moussa hasanzadeh as the head devloper %%
%All rights reserved.                                             % 
%programed in mathlab 2016                                 
%gmail:mo30no@gmail.com
%phone 09147082079


%% clear and close all child forms
delete(allchild(0));close all;
clear;
clc;

%% plot coordinates system in 3D area and labeling
plot3([-5;5],[-5;5]*0,[-5;5]*0,'k');hold on;
plot3([-5;5]*0,[-5;5],[-5;5]*0,'k');hold on
plot3([-5;5]*0,[-5;5]*0,[-5;5],'k');hold on
text([-6;6],[-6;6]*0,[-6;6]*0,{'-X','X'});hold on;
text([-6;6]*0,[-6;6],[-6;6]*0,{'-Y','Y'});hold on
text([-6;6]*0,[-6;6]*0,[-6;6],{'-Z','Z'});hold on
xlabel('X');
ylabel('Y');
zlabel('Z');


%% convert implicit plan formula as parametric form
syms x y z scalerVal t;
plan='0*x+3*y+2*z+3';%% plan as inplicit form

%function to draw on the plan
t=-3.14:.2:3.14;
p=sin(t);%x coordinate
q=cos(t);% y coordinate

pluIdex=strfind(plan,'+');%% find plus index in plan formula
scalerIndex=strsplit(plan,'+');
for s=1:length(scalerIndex)
    scalerVal=str2num(scalerIndex{s});
    if ~isempty(scalerVal)
        break;
    else
        scalerVal=0;
    end
end

%% extract z coff

zIndex=strfind(plan,'z');
if ~isempty(zIndex)
    pluIZ=pluIdex(pluIdex<zIndex);
    if ( pluIZ)
        pluIZ=pluIZ(end);
        cofZIndex=pluIZ+1:zIndex-2;
        cofZ=str2double(plan(cofZIndex));
    else
        if (zIndex>1)
            pluIZ=1;
            cofZIndex=pluIZ:zIndex-2;
            cofZ=str2double(plan(cofZIndex));
        else
            cofZ=1;
        end
    end
else
    cofZ=0;

end
%% extract y coff

yIndex=strfind(plan,'y');
if ~isempty(yIndex)
    pluIY=pluIdex(pluIdex<yIndex);
    if ( pluIY)
        pluIY=pluIY(end);
        cofYIndex=pluIY+1:yIndex-2;
        cofY=str2double(plan(cofYIndex));
    else
        if (yIndex>1)
            pluIY=1;
            cofYIndex=pluIY:yIndex-2;
            cofY=str2double(plan(cofYIndex));
        else
            cofY=1;
        end
    end
else
    cofY=0;

end
%% extract x coff
xIndex=strfind(plan,'x');
if ~isempty(xIndex)
    pluIX=pluIdex(pluIdex<xIndex);
    if ( pluIX)
        pluIX=pluIX(end);
        cofXIndex=pluIX+1:xIndex-2;
        cofX=str2double(plan(cofXIndex));
    else
        if (xIndex>1)
            pluIX=1;
            cofXIndex=pluIX:xIndex-2;
            cofX=str2double(plan(cofXIndex));
        else
            cofX=1;
        end
    end
else
    cofX=0;

end

coff=[cofX,cofY,cofZ];


funcIndex=find(coff);funcIndex=funcIndex(end);
switch funcIndex
    case 1
        y=[-2:2];
        z=[-2:2];
        [y,z]=meshgrid(y,z);
        x=-(coff(2)/coff(1))*y -(coff(3)/coff(1))*z-scalerVal/coff(1);
        t=[-2:2];
        
        
    case 2
        x=[-2:2];
        z=[-2:2];
        [x,z]=meshgrid(x,z);
        y=(coff(1)/coff(2))*x +(coff(3)/coff(2))*z+scalerVal/coff(2);

    case 3
        x=[-2:2];
        y=[-2:2];
        [x,y]=meshgrid(x,y);
        z=(coff(1)/coff(3))*x +(coff(2)/coff(3))*y+scalerVal/coff(3);

        ft=(coff(1)/coff(3))*p +(coff(2)/coff(3))*q+scalerVal/coff(3);
end


surf(x,y,z)
plot3(p,q,ft)


نمونه خروجی:


دانلود کد:

۰ نظر موافقین ۰ مخالفین ۰ ۲۱ تیر ۰۱ ، ۰۹:۴۹
موسی حسن زاده