
سه شنبه, ۲۱ تیر ۱۴۰۱، ۰۹:۴۹ ق.ظ
نحوه رسم یک نمودار یا چند ضلعی در روی صفحه دلخواه
در این پست برخلاف پست های قبلی که رسم نمودار نیاز به کمی مهارت داشت، می توانید بدون نیاز به تلاش بیشتر، با تغییر p به عنوان مختصه نسبی x و q به عنوان مختصه نسبی y، نمودار یا چند ضلعی دلخواه خود را روی صفحه دلخواه( با تغییر فرمول صفحه) رسم کنید.
البته توصیه می شود که کد را آنالیز کنید و هر جا مشکل داشتید می توانید در بخش نظرات پرسش خود را مطرح کنید،
تذکر به نظران خصوصی پاسخ داده نمی شود.
کد اجرایی:
%%%%%%%%%%%%%%%%%%%%%%%%%%-----------software details-----------%%%%%%%%%%%%%%%%%%%%%%

%devloped in Iran(ardebil)                                       %
%Copyright (C) 2017(1396) by moussa hasanzadeh as the head devloper %%
%All rights reserved.                                             %
%programed in mathlab 2016
%gmail:mo30no@gmail.com
%phone 09147082079


%% clear and close all child forms
delete(allchild(0));close all;
clear;
clc;

%% plot coordinates system in 3D area and labeling
plot3([-5;5],[-5;5]*0,[-5;5]*0,'k');hold on;
plot3([-5;5]*0,[-5;5],[-5;5]*0,'k');hold on
plot3([-5;5]*0,[-5;5]*0,[-5;5],'k');hold on
text([-6;6],[-6;6]*0,[-6;6]*0,{'-X','X'});hold on;
text([-6;6]*0,[-6;6],[-6;6]*0,{'-Y','Y'});hold on
text([-6;6]*0,[-6;6]*0,[-6;6],{'-Z','Z'});hold on
xlabel('X');
ylabel('Y');
zlabel('Z');


%% convert implicit plan formula as parametric form
syms x y z scalerVal t;
plan='0*x+3*y+2*z+3';%% plan as inplicit form

%function to draw on the plan
t=-3.14:.2:3.14;
p=sin(t);%x coordinate
q=cos(t);% y coordinate

pluIdex=strfind(plan,'+');%% find plus index in plan formula
scalerIndex=strsplit(plan,'+');
for s=1:length(scalerIndex)
    scalerVal=str2num(scalerIndex{s});
    if ~isempty(scalerVal)
        break;
    else
        scalerVal=0;
    end
end

%% extract z coff

zIndex=strfind(plan,'z');
if ~isempty(zIndex)
    pluIZ=pluIdex(pluIdex<zIndex);
    if ( pluIZ)
        pluIZ=pluIZ(end);
        cofZIndex=pluIZ+1:zIndex-2;
        cofZ=str2double(plan(cofZIndex));
    else
        if (zIndex>1)
            pluIZ=1;
            cofZIndex=pluIZ:zIndex-2;
            cofZ=str2double(plan(cofZIndex));
        else
            cofZ=1;
        end
    end
else
    cofZ=0;

end
%% extract y coff

yIndex=strfind(plan,'y');
if ~isempty(yIndex)
    pluIY=pluIdex(pluIdex<yIndex);
    if ( pluIY)
        pluIY=pluIY(end);
        cofYIndex=pluIY+1:yIndex-2;
        cofY=str2double(plan(cofYIndex));
    else
        if (yIndex>1)
            pluIY=1;
            cofYIndex=pluIY:yIndex-2;
            cofY=str2double(plan(cofYIndex));
        else
            cofY=1;
        end
    end
else
    cofY=0;

end
%% extract x coff
xIndex=strfind(plan,'x');
if ~isempty(xIndex)
    pluIX=pluIdex(pluIdex<xIndex);
    if ( pluIX)
        pluIX=pluIX(end);
        cofXIndex=pluIX+1:xIndex-2;
        cofX=str2double(plan(cofXIndex));
    else
        if (xIndex>1)
            pluIX=1;
            cofXIndex=pluIX:xIndex-2;
            cofX=str2double(plan(cofXIndex));
        else
            cofX=1;
        end
    end
else
    cofX=0;

end

coff=[cofX,cofY,cofZ];


funcIndex=find(coff);funcIndex=funcIndex(end);
switch funcIndex
    case 1
        y=[-2:2];
        z=[-2:2];
        [y,z]=meshgrid(y,z);
        x=-(coff(2)/coff(1))*y -(coff(3)/coff(1))*z-scalerVal/coff(1);
        t=[-2:2];


    case 2
        x=[-2:2];
        z=[-2:2];
        [x,z]=meshgrid(x,z);
        y=(coff(1)/coff(2))*x +(coff(3)/coff(2))*z+scalerVal/coff(2);

    case 3
        x=[-2:2];
        y=[-2:2];
        [x,y]=meshgrid(x,y);
        z=(coff(1)/coff(3))*x +(coff(2)/coff(3))*y+scalerVal/coff(3);

        ft=(coff(1)/coff(3))*p +(coff(2)/coff(3))*q+scalerVal/coff(3);
end


surf(x,y,z)
plot3(p,q,ft)
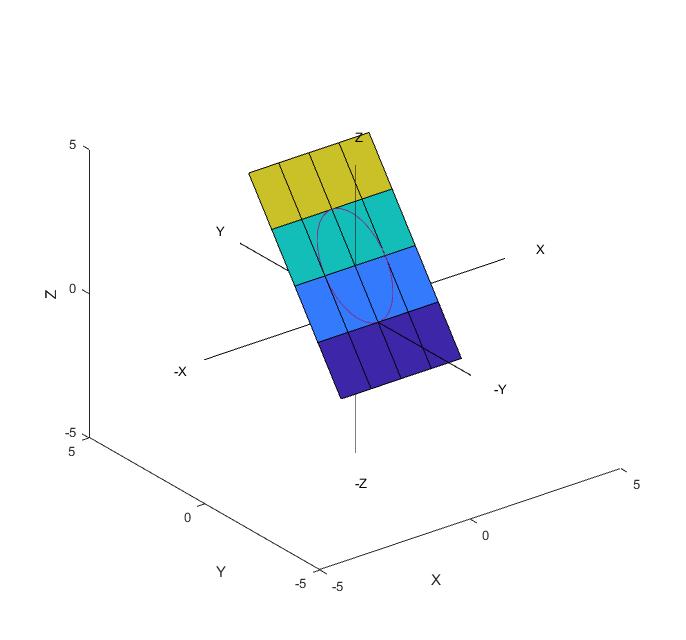
نمونه خروجی:
دانلود کد:
